
What is the Net Promoter Score?
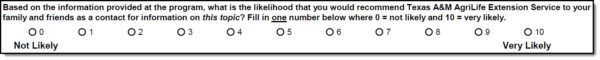
The Net Promoter Score® (NPS) is a measure of clientele loyalty. NPS is calculated from responses to one simple question, measured on a 0-to-10 rating scale: “Would you recommend us to a friend or colleague?” Based on the NPS, each client is placed into one of three categories: promoters, passives, and detractors. Ultimately, the goal of using the NPS is to increase promoters and decrease detractors. Promoters are (9,10) on the scale; passives are (7,8) and detractors are 6 and below.
The net promoter score is calculated from the valid percentages of frequency distribution table as follows: NPS = Percent (10, 9) – Pct (6 or less). Percent (8, 7) is not used.
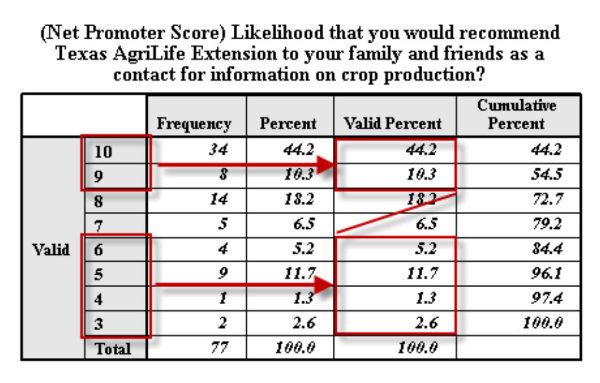
n this case, the NPS is (44.2% + 10.3%) – (5.2% + 11.7% + 1.3% + 2.6%) = 33.7%. The actual calculation by the statistical software may be slightly difference (but more accurate) than the hand calculation.
The NPS will be displayed in similar fashion to the output below. The first table shows the distribution (count and percentage) of clients from your event that fall into each of the three client categories. The second tables shows the actual calculation of NPS for your event. The final table shows the NPS for your event (33.7). The closer the NPS is to 100, the better. This number can be compared against other programs or aggregated to get a better sense of how clientele value Extension programs.

Texas A&M AgriLife Extension Service ANR Program’s adoption of the Net Promoter Score as a measure of customer loyalty and program performance began in 2008 with several wildlife programs. Since then, extension’s adaptation of the Net Promoter Score question has been included in most new ANR evaluation instruments – encompassing a wide variety of different subject matter areas.